Investment update: start of the recovery
The document below is a (an anonymised) the update sent to our investors at the delayed end of the second semester of the 2020-2021 academic year:
Dear Investor,
For Brighter Investment as an education financial institution, the negative impact of Covid could have been devastating. A loan model would see default rates shoot up under the current economic circumstances, our more robust income sharing model sees delayed repayments but still no defaults. We believe our model is stronger because it allows us to stay the course in a global pandemic, helping students realize their potential and investors realize value over time.
In the short term, there is an impact on the financial performance of your investment with us. In our last update, we reported that our graduate unemployment rate has gone up because employers are hiring less due to Covid. A large graduatign cohort means that the current graduate unemployment rate of 28.7% is well above our target of 10%, but due to the diversification of our portfolio of the brightest students with quality degrees, we do expect our students to continue to outperform the market in terms of finding jobs and repayment as the impact of Covid fades.
BI students are already finding jobs 66% faster than they did at the height of the pandemic. Over the last three semesters, the average amount repaid by graduated BI students is 81% higher than what it was in the three months before Covid. These signs of recovery mean that when compared to the previous semester, distributions are up by 33%. Quality students with good degrees may see their careers delayed by school closures and hiring pauses, but they will find good jobs and thus will repay. Unfortunately, that doesn’t mean that at BI we can say we survived the pandemic, yet.
ASK FOR INVESTMENT: As you are aware, Brighter Investment’s model has a long validation period; from students studying to graduating, and finally making repayments. For our business model break-even occurs around 1000-1200 students, this means that continued fundraising is necessary to not only keep growing but also keep going during this start-up phase. Covid has meant a delay in accomplishing our goals, but given the aforementioned signs of recovery, we are seeking investments to help us get back on track to our goal of supporting thousands of the best and brightest African students.
With your investment, we’ve shown that our model works and our students are worth investing in. Although this traction is expected to attract other investors to invest in our model, this has proven to be especially hard to achieve in the era of Covid. We entered the pandemic well funded, but struggled to raise money for the 2021/2022 academic year. As it stands now, we need more funding before January 2022 to support our 180 continuing students and keep the organization going.
Our business model has not changed and our value proposition still holds; there is tremendous value in educating the best and the brightest. Our current default rate of 0% and 0.68% dropout rate is proof that our model works. That is why we are raising a top up round to help us through to September 2022 (details in attached pitch deck). After that, we intend to return to growth and expect to return to a more stable world where more investors invest in our value-creating model.
We know that by investing with BI you are committed to helping the best and brightest reach their potential, we need your help to get them through the pandemic and its impacts and towards a brighter future.
Belinda Kugblenu
Investor Relations
1. Your investment value
The projected values for your investment have been modeled with increased unemployment. This is because the downturn of the labor market has directly affected our graduated students.
Unfortunately, graduate unemployment is the same as what we reported in the last update. Many students have found jobs since then, but students in our 2019/2020 cohort have finished their mandatory national internship and are now also looking for jobs. What we have observed is that the labor market is gradually gaining momentum so we expect more of our unemployed students to secure employment and start making repayments.
Students in the 2020/2021 cohort are least affected by the slowdown in the labor market because they are not expected to enter the labor market anytime soon. To be conservative when signing up these latest students, we included a longer repayment period in their contracts resulting in a higher projected ROI for these students when compared to previous cohorts. We expect this to mitigate the risk of the projected ROI being negatively affected by unforeseen events in the future.
The table below provides details on the book value of your investment, which is the minimum amount we need to repay to you without BI defaulting on its obligations. The second higher valuation is the net present value of projected future cash flows discounted by the expected total IRR:

Investment amounts for an investor that invested $100k every year, distributions paid out or reinvested in later cohorts, projected values, and book values for those investments.
2. Performance of the student cohorts
The total number of students in our portfolio is 439. 180 out of 439 students are studying this year and are at different levels of their degree programs. 259 students have graduated and 88 of these students are doing their mandatory national service. At the same time, 164 graduates are in the repayment phase of the program and 7 students have finished repaying.
Of our continuing students, 30% are pursuing a science degree (mostly applied sciences), 37% are pursuing an engineering degree, 6% are pursuing IT-related degrees, and 27% business-related degrees (accounting, finance, business, etc.) The table below represents the current status of all the students we have supported so far.
The 2021/2022 academic year for our students is scheduled to begin in January 2022. Due to Covid, the 2020/2021 academic calendar for students started in January 2021 which meant that students were expected to complete their coursework for the year by August 2021. Even though some of our students were able to achieve this, others at some of our partner universities were unable to. In order for all universities to commence the new academic year simultaneously, the proposed date for commencement is January 2022. This delay in graduations and thus employment and repayments further contribute to lower distributions in the near future but higher repayments in later years.

Current study progress for all investor cohorts.
3. Key performance indicators
Various KPI’s are important for your ROI. For the most relevant of these variables, we compare the values used for the projections to the values as observed to date. Based on these results we use conservative estimates to provide you with an updated ROI projection.

Relevant Key Performance Indicators and values used for our financial projections.
Unemployment: 29% of our graduated students are unemployed, due to the economic fallout of Covid it is taking graduates longer to find work and we have had large cohorts of students graduate recently. If students find jobs as expected, this number will go down before going up again when the next cohort finishes their national service next year.
To help bring this number down, we have partnered with a recruitment agency to help facilitate more direct placement of our graduates into jobs. We are also increasing our engagement time with unemployed students to ensure they have the required skills to sell themselves adequately for job roles. With these measures, combined with an improving economy, we expect the number of our unemployed graduates to go down over the next few months and eventually return to sub 10% nrs we had before Covid.
Dropouts: Our current dropout rate is 0.068% which is four of our students dropping out. This dropout rate is 5X lower than the average rate recorded by our partner universities. One of the students who dropped out has finished making repayments and the other three are in the repayment phase.
Defaults: All graduate students are reporting their employment status, and all working graduates are making their monthly repayments as required. To be conservative in our projections, we have modeled a rate of 10% to cover the number of students we expect to not repay.
Salary levels: Graduates mostly earn what we expect in the local currency, and are once again earning what we projected in USD despite covid. Our graduates have increased their income 5X on average with their degrees. That said, a subset of graduates that haven’t been able to find employment yet has taken lower-paid jobs. Our student success manager is working with these graduates to find them employment at their education level.
Repayments: Our working graduates are making repayments as expected. The total amount of repayment received this semester was 33% higher than what we received in the previous semester. We expect that as more students find jobs, distributions will be higher again in the coming year. Due to the structure of the sponsorship contract, for every month a student is unemployed, their repayment period goes up by 0.25 months. This means that longer unemployment periods result in slightly longer total repayment periods that ensure that the same ROI is maintained for investors. Below is a graph that shows how repayments received from students are growing despite Covid.
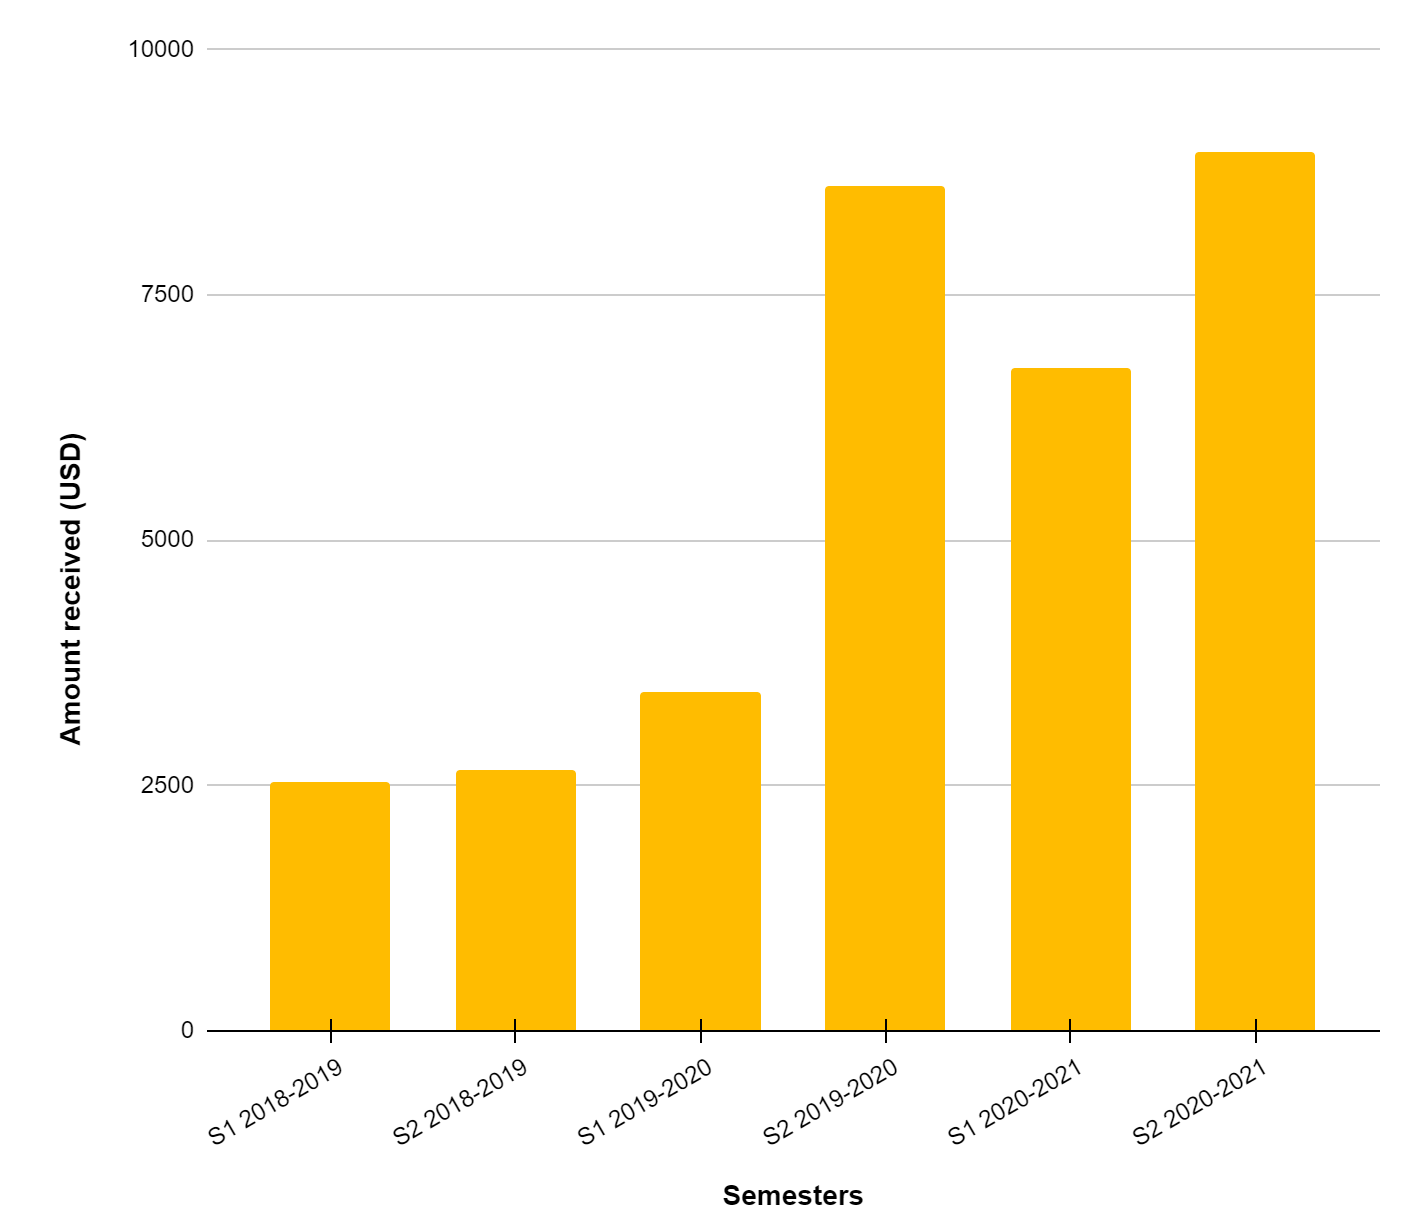
Total repayments are recovering from covid and are expected to continue to grow.
4. Cash flow projections
The graphs on the next page show how your investment in the various cohorts is expected to perform. These cash flow projections are based on increased unemployment and more time required to find work for graduate students in the near future. Our goal is to engage our partner recruitment agency and implement an improved student success mentorship program to help students find jobs faster. This will reduce the negative impact on your investment and we hope that in a year from now we’ll be able to revise our projections back upwards.

Projected distributions and paid out distributions for your 2016/2017 cohort investment. Distributions for both the semesters paid out in March and September of an academic year are combined, starting with the 2018-2019 academic year.

Projected distributions and paid out distributions for your 2017/2018 cohort investment per academic year.

Projected distributions and paid out distributions for your 2018/2019 cohort investment per academic year.

Projected distributions for your 2019/2020 cohort investment per academic year.

Projected distributions for your 2020/2021 cohort investment per academic year.

Projected distributions for your 2021/2022 cohort investment per academic year.
In conclusion, distributions are lower than projected in the near term due to a higher unemployment rate and delays from school closures, but solid in the long term:
Our graduated students are taking an average of eleven months after their mandatory national internship to find jobs instead of the average six months before covid. This has resulted in a higher unemployment rate than we projected. School closures have delayed graduation and thus employment and repayment further. The resulting ROI is revised slightly downwards because the income for especially the earlier cohorts has been and will be delayed in the near future.
Our income sharing model ensures that defaults remain near 0% and the quality of our students and their degrees near guarantee that they will find work in the foreseeable future and start repaying. We have started to see an improvement in the employment of our graduates and expect this to continue into a full recovery.